Maternal and children
nutrition in northern Mozambique: a mixed methods study.
Ganhão C,1 Pires P,1
Couto S,1 Valente A,1 Mupueleque M,1 Marega A,1
Muoki P.2
(1)
Faculdade de Ciências
de Saúde, Universidade Lúrio, Marrere, Nampula, Mozambique.
(2)
International
Institute of Tropical Agriculture, Nampula, Mozambique.
Introduction: children malnutrition is
a public health problem in Mozambique and we know that integrated agriculture
and nutrition interventions can mitigate malnutrition adverse effects,
especially during the first 1,000 days of life. For an agriculture intervention
positively impact on nutrition, the implementation must be purposely designed
to achieve this objective; this baseline survey was carried out to benchmark a project
progress towards attaining its objectives as well as in guiding implementation
process.
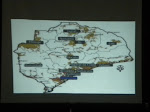
Methods: descriptive mixed methods
research to evaluate the nutritional status of mother-child (aged from 6 to 24
months) pairs, food availability and consumption trends. Focal group
discussions to prepare food demonstration tools, a structured questionnaire for
24h-recall and a food frequency questionnaire to collect data were used. We
surveyed randomly selected households in Malema and Gurué districts, Northern
Mozambique.
Results: 577 infant-mother pairs were
surveyed and we found a high prevalence of children born underweight (18.8 %),
a prevalence of chronic and acute malnutrition of 6.0 % and 12.0 %,
respectively. A double burden of malnutrition (underweight and overweight) was
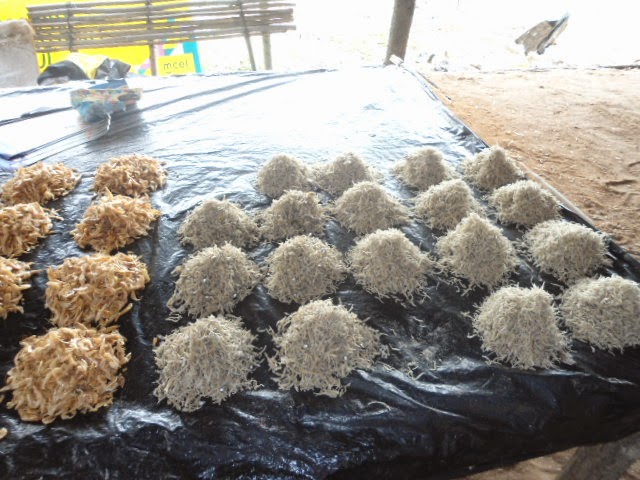
found among mothers. Both Malema and Gurué districts produce various food
crops. Legume crops are the main protein source for most households. The 24 h -
recall indicated that the median protein consumption among infants was 25.3 g /
day, threefold higher than the recommended protein intake from complementary
foods, assuming a child is breastfeeding as is expected for children below two
years.
Conclusion:
this
baseline survey highlighted the nutrition status of infant-mother pairs in
Malema and Gurué districts, Mozambique, showing a children nutritional positive
evolution since the 2011 Mozambican Demographic and Health Survey. Malnutrition
double burden (under and overweight) attains mothers and possible underlying
factors for the nutrition status were underscored. Potential intervention
niches for an integrated agriculture and nutrition project were highlighted.
Key
words: children, malnutrition, maternal,
Mozambique, nutrition, overweight, underweight.
- Introduction.
Maternal and children under nutrition
in low and middle-income countries encompasses both under nutrition and a
growing problem with overweight and obesity. (1) Annually, under
nutrition accounts for 3.5 million deaths with over half of the global child
mortality occurring in Africa. Under nourished children have an increased death
rate from diarrhoea, pneumonia, measles, and other infectious diseases. (2)
In Mozambique, the prevalence of stunting is 43 %, (3) and it is
responsible for over a third of deaths among children aged less than five
years. Undernutrition prevalence rates differ within the country, with the northern
part (Nampula Province) having the highest prevalence (55 %). Undernutrition is
not only a health but also an economic problem, being responsible for a 2 – 3 %
loss of internal product. Chronic under nutrition is recognized as the best
indicator of the quality of human capital. (4)
Maternal and child under nutrition
including stunting, wasting and deficiency of essential vitamins and minerals
has been a subject of discussion by various professional, who agree there is
potential for reduction through equitable coverage of proven nutrition
interventions. The need to focus on the crucial period from conception, through
the first two years of life (the first 1,000 days), during which good nutrition
and healthy growth have lasting benefits throughout life has been recommended. (5)
In Sub-Saharan Africa, millions of
households depend on agriculture for income and food. In 2006 80 % of
Mozambicans lived in rural areas depending on agriculture for their livelihood.
Agricultural interventions have long been thought to influence nutrition. In
the past 10 - 15 years, people have accepted that for agricultural intervention
to have greater chance of affecting nutrition status, they must be implemented
with that objective. (6) Northern Mozambique is considered the country’s
food basket as most food production happens there. (7) However,
there is high prevalence of undernutrition in northern Mozambique compared to
other parts of the country, an example that agriculture or high food production
does not always translate into better nutritional outcomes.
During 2011 - 2015, the International Institute of Tropical
Agriculture (IITA) has set out to implement a nutrition sensitive project,
with the aim to increase soybean production and consumption for better
nutrition. To effectively implement and measure project’ progress, a baseline
survey was performed, in cooperation with Lúrio University (LU) Health Sciences
Faculty researchers, to assess the nutritional status of the key beneficiaries
of the project (body mass index – BMI - of women and children aged from six
months to two years), local dietary characteristics (components and preparation
techniques), food availability and consumption trends among this target
population.
2.
Methods.
Descriptive mixed methods study, using
qualitative and quantitative tools to gather data from children of age between
6 and 24 months and their mothers, in Gurué (Zambézia Province) and Malema
(Nampula Province) districts in Mozambique, during April and May 2013.
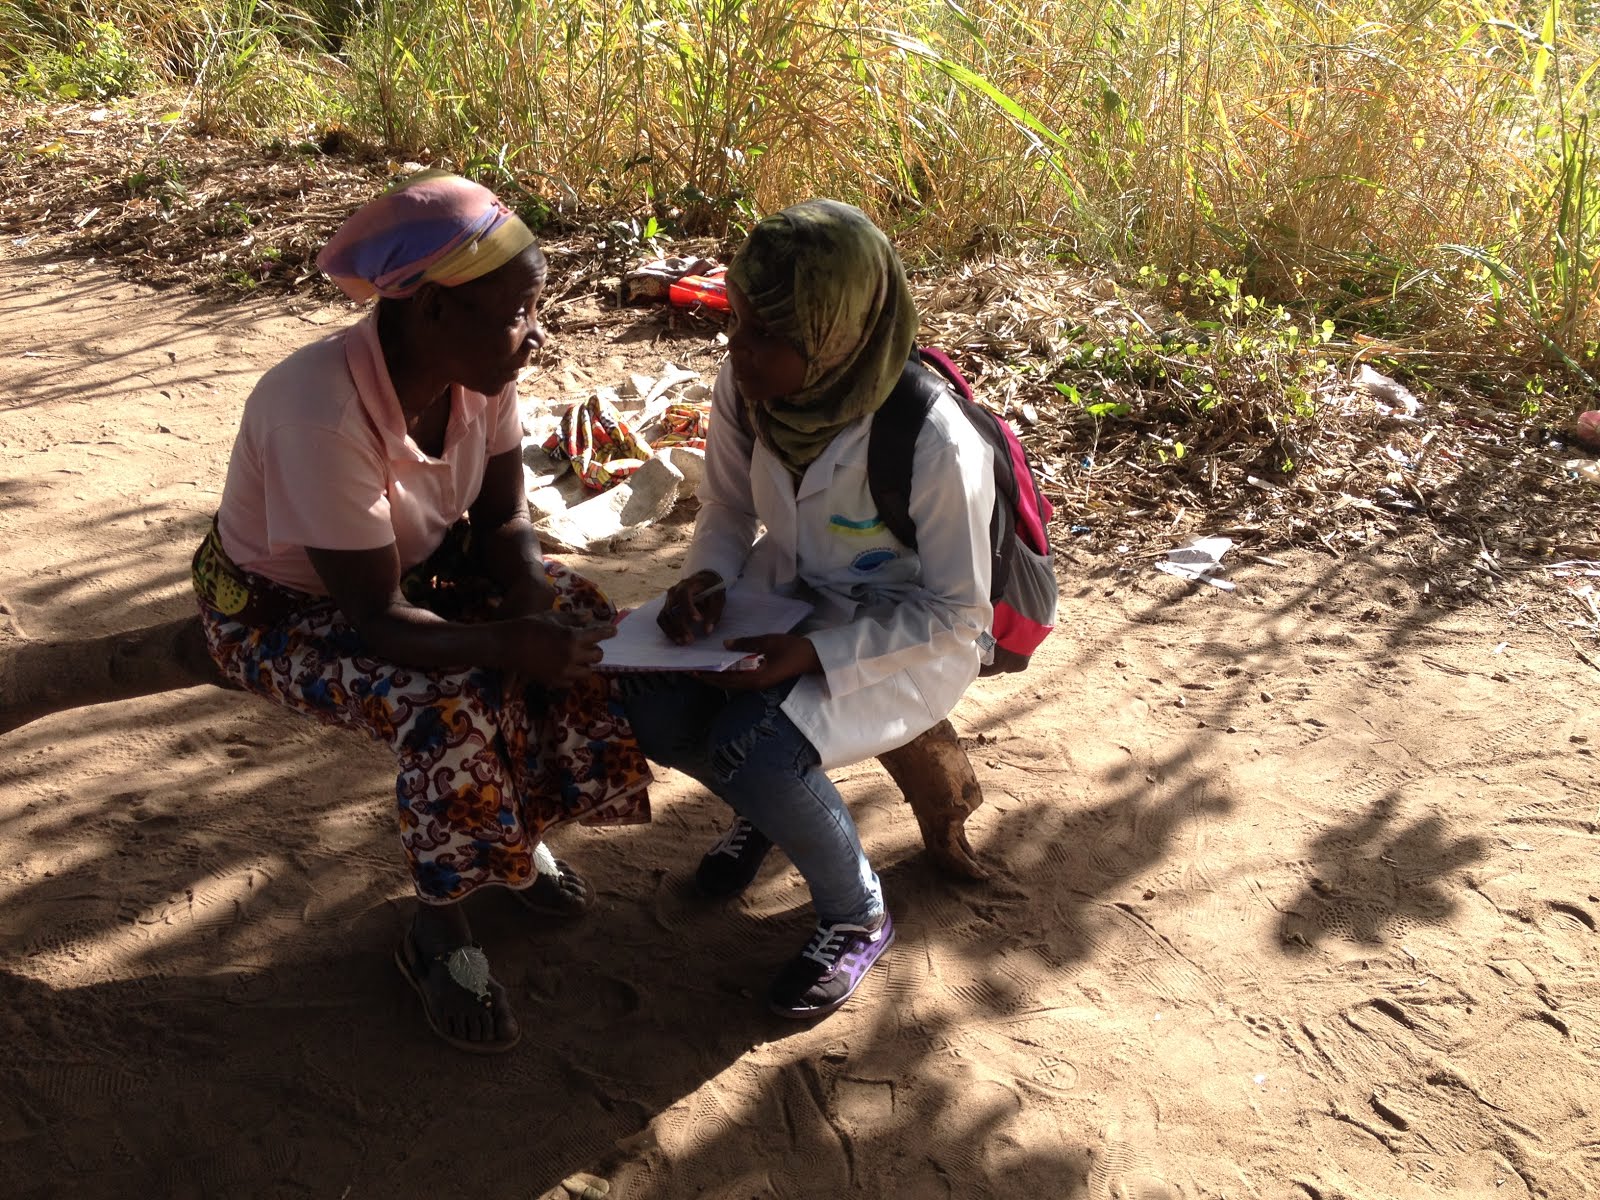
Initial interactions with key
informants during focus group discussions (FGD) were used to appraise the type
of foods that were commonly eaten in the community and their methods of
preparation. FGD also aided to develop the food frequency questionnaire (FFQ)
as foods available in the study area were documented. For quantitative data, we
used a questionnaire that contained agriculture and nutrition related questions
including a 24 h - recall.
FGD and development of a
pictorial manual.
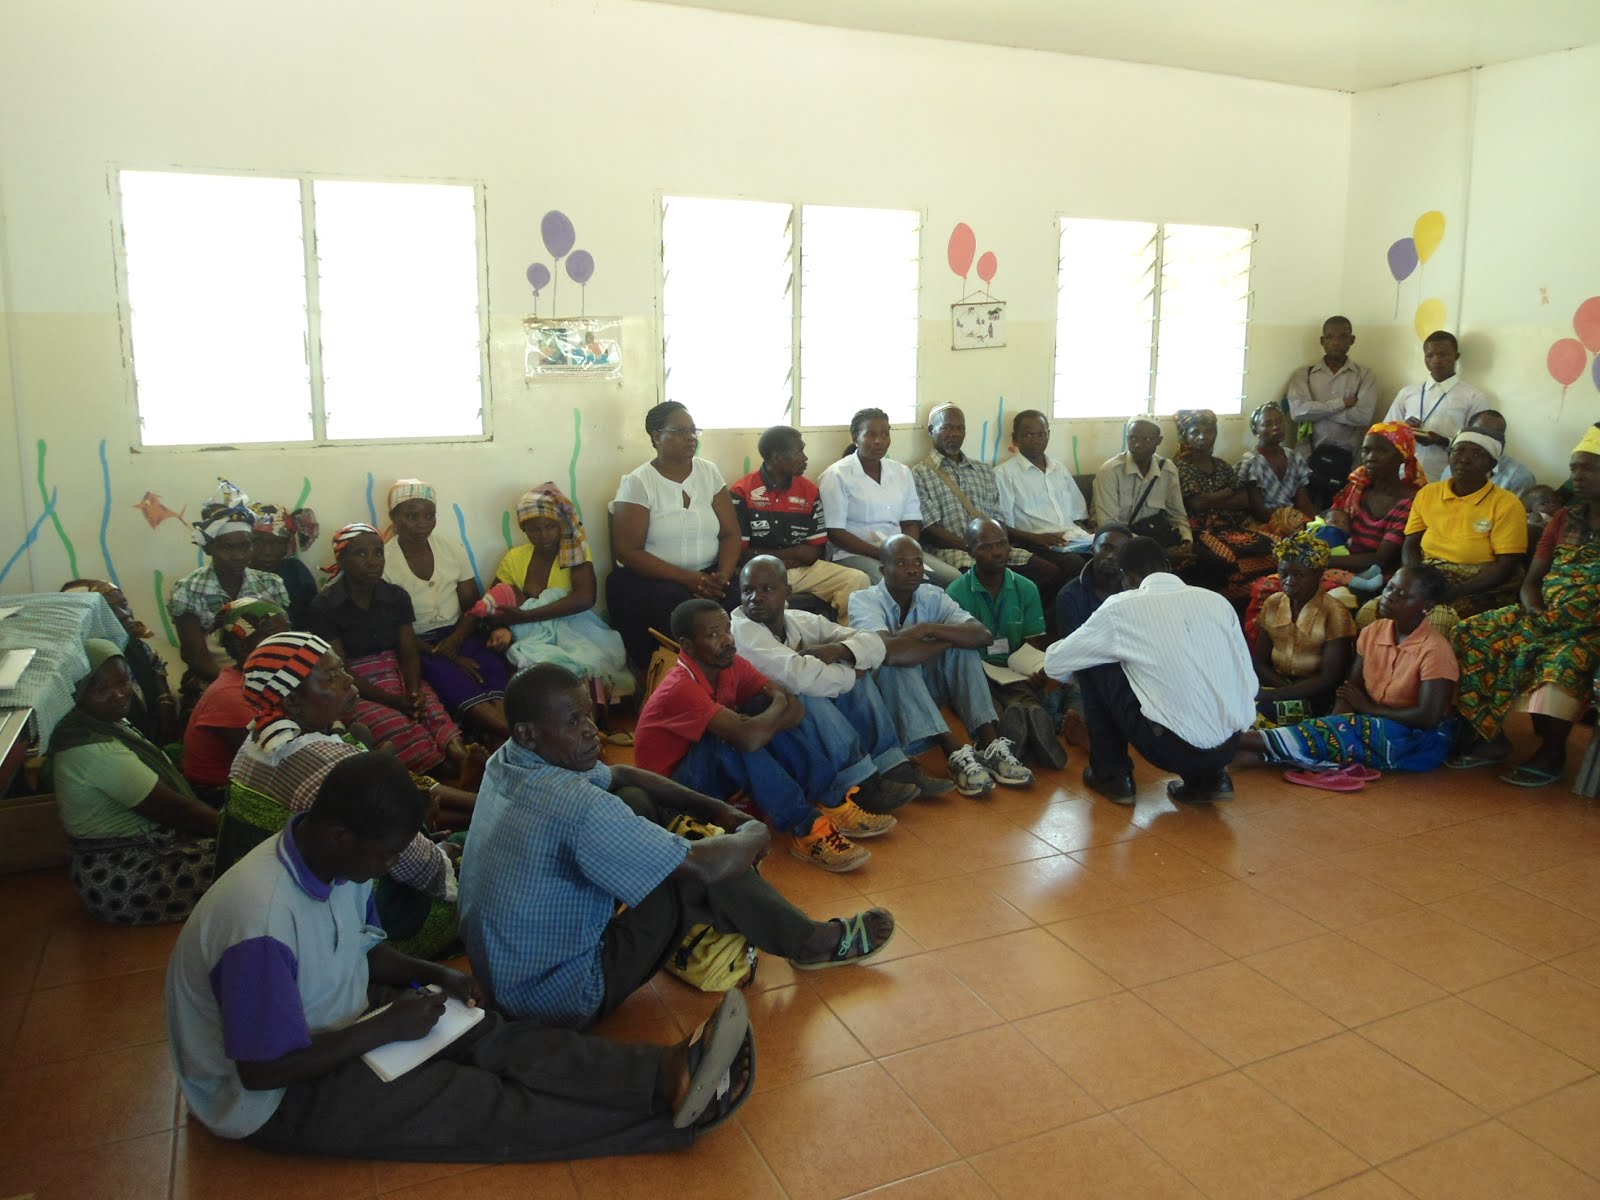
FGD were conducted in the study area
to gather information on types of food typically eaten, with women of
reproductive age group (n = 68). A structured questionnaire was used to guide
the discussions.
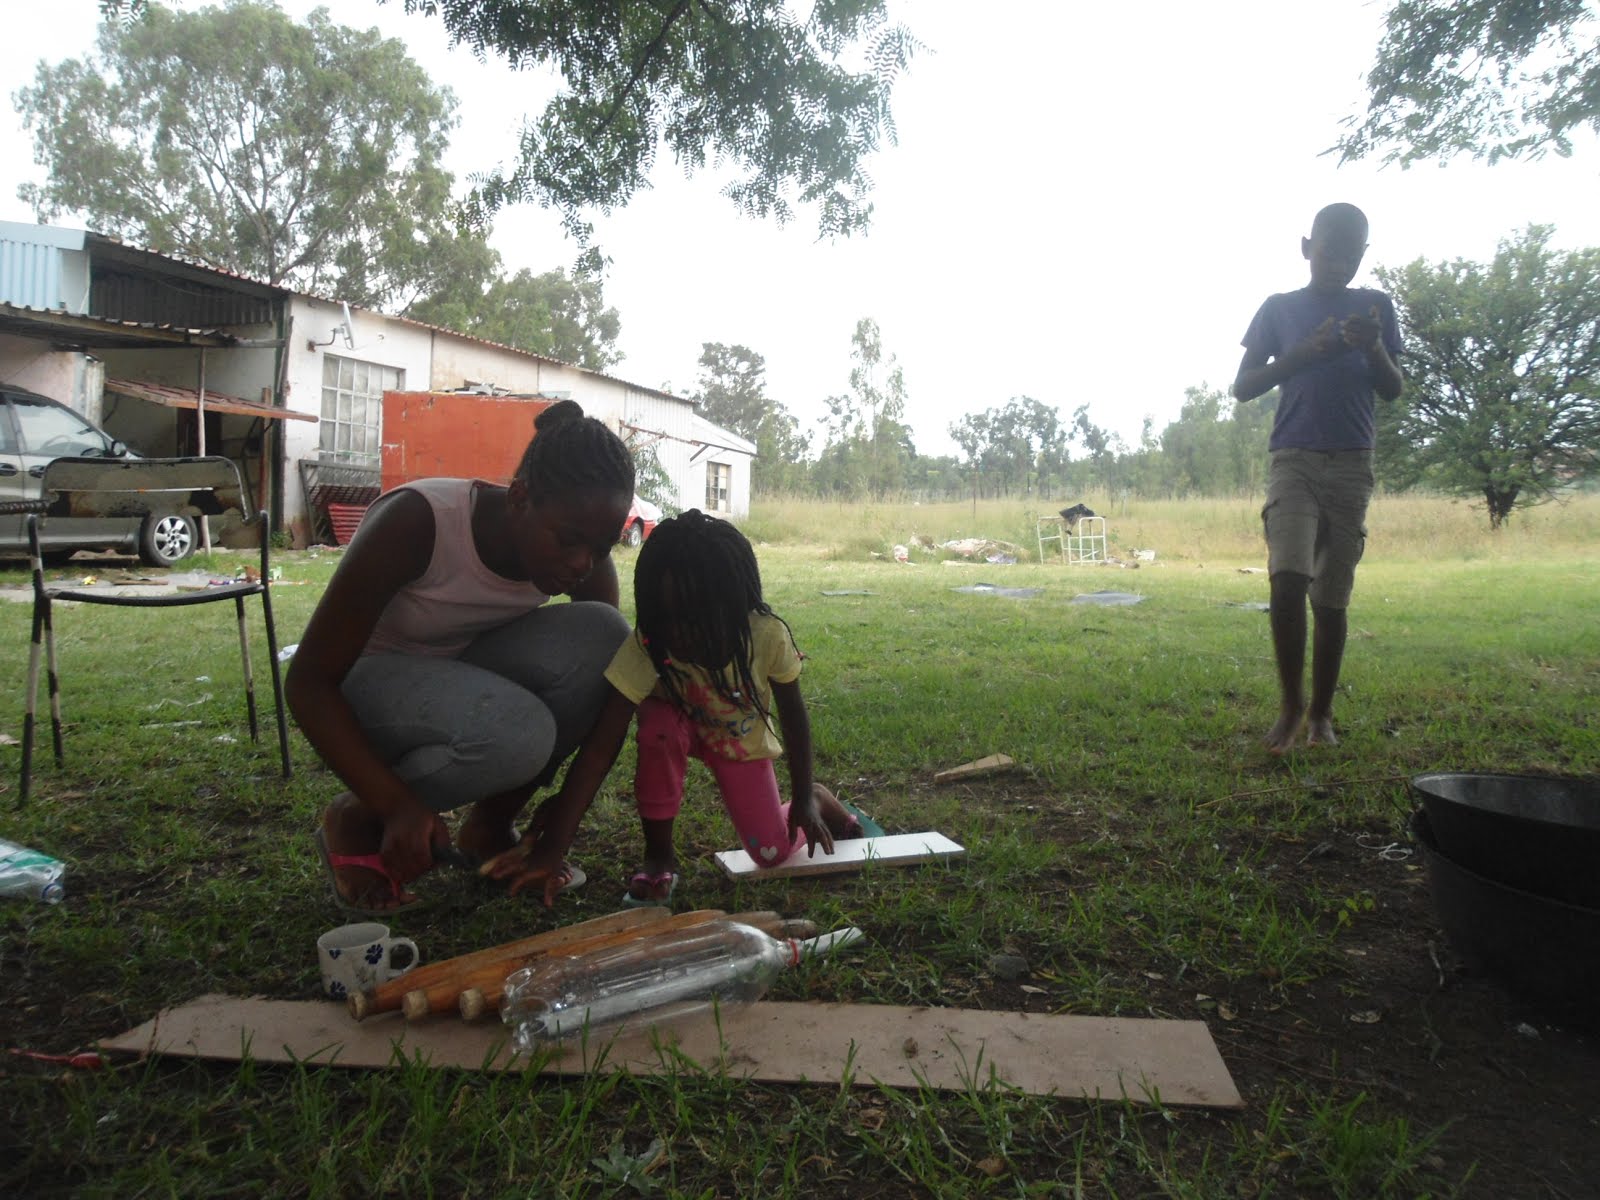
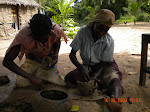
Using information gathered through FGD,
a pictorial manual showing an illustration of food combinations, that would
normally be served for a normal meal, was developed. Three local women prepared
various recipes described by FGD. The women served the various food combinations,
as they would do normally. The weight of each food type on the plate was then
recorded and photographed to guide interviewers while filling the 24 h - recall
questionnaire.
Sample selection.
A total of 612 households
participated in the study. Children aged from 6 to 24 months and their mothers
qualified to participate. The number of children to be surveyed, was calculated
per district, using Nampula and Zambézia Provincial Health Directorates
(Ministry of Health) data about undernutrition prevalence, plus a 10 % chance
of non-respondents. The respondents were randomly selected from a list of all
qualifying households.
Data collection.
Ethical clearance was provided by the
Institutional Bioethics for Health Committee of LU. Data were collected using a
structured questionnaire, record of anthropometric measurements of infant - mother
pair, 24 h - recall for children and FFQ. BMI was calculated and categorized
following the guidelines of National Institute of Health, 1998. Software Antro® of World Health Organization (WHO) was
used to determine the undernutrition indicators for children.
For the 24 h - recall of foods eaten,
data were collected for all foods and drinks consumed during the last 24 hours
before the interview. Details of commercial products were taken so as the
detailed ingredients for the various recipes. At the end of the 24 h - recall,
the respondent was asked whether food intake in the previous day was normal,
whether any supplements or medication was consumed, and whether the infant or
mother was sick or had low appetite for food.
Foods recorded in the 24 h - recall
were tabulated into specific nutrients using Food Processor Plus® based on United
States Department of Agriculture food composition tables. The LU Nutrition Department
adapted these tables based on recipes that were typical to Mozambique. Food
composition data from Brazil was also used in the absence of some foods in the Mozambican
food composition table.
Nutrient consumption
evaluation.
The following nutrients were selected
to evaluate intake: total energy, carbohydrates, total fat, proteins, vitamin A,
D, E, B1, B2, B6, B12, folate, iron, calcium, iodine, zinc, phosphorus and
magnesium. Children and adults used the WHO recommendations to determine
prevalence of inadequate caloric intake. A comparison was made to the
recommended dietary intake of the various nutrients to determine adequate
intake. Acceptable macronutrient distribution ranges from 20 – 35 % for protein,
45 – 65 % for carbohydrates and 10 – 35 % for total fat, were used to calculate
the contribution of various nutrients to total energy. (8) To
calculate inadequacy of micronutrient intake, estimated average requirement
(EAR) was used as the cut-off point. (9)
Statistical analysis.
Data analyses used Statistical
Package for the Social Sciences version 19.0®. Significance level was set at 5 %.
Qualitative variables were represented as proportions and were compared using Chi-square
and Fisher whenever applicable. To describe ingestion of various nutrients,
median was used and percentile 25 (P25) and 75 (P75). To compare variations in
ingestion of nutrients, T – Student test was used or Mann - Whitney test for non
- parametric data.
3.
Results and discussion.
Study population.
Study population and its characteristics
can be seen on table I and II. We interviewed mainly pairs of infant and mother
(95 %). The respondents were well distributed between the two districts with
the households from Malema and Gurué being 317 and 295, respectively. Boys
represented 47.7 %, 577 mothers participated in the study with 292 (50.6 %) and
285 (49.4 %) being from Malema and Gurué districts, respectively.
Over 70 % of both children parents
had either never studied or did not complete primary school education, while
less than 3 % had completed secondary education. The Mozambique Millennium
Development Goals Report 2005 (MMDGR) cited low access to education among women
as a challenge to improved child-wellbeing. (10) The 2008 - 2009
Kenya Demographic Health Survey found a direct
correlation between mother education and compliance with minimum infant and
young child feeding practices. The 2011 Mozambique Demographic and Health
Survey (MDHS) found infant mortality to be highest among children born to
mothers who have low level of education. Often, these deaths are due to under
nutrition.
Families with more than
one child aged less than 2 years were 21 %. Short child-birth interval
increases chance of a child becoming undernourished. The Kenya National Bureau
of Statistics in 2010 found an inverse relationship between the length of the
preceding birth interval and the proportion of children who were stunted.
Similar trends were reported in the MDHS.
Table
I: study population.
Characteristics
|
Total
n (%)
|
Malema
n (%)
|
Gurué
n (%)
|
Nº of children
|
612 (94.2)
|
317 (51.8)
|
295 (48.2)
|
Sample distribution
|
|
|
|
Boys
|
291 (47.7)
|
154 (48.6)
|
137 (46.4)
|
Girls
|
321 (52.3)
|
163 (51.4)
|
158 (53.6)
|
Mothers
|
577 (88.8)
|
292 (50.6)
|
285 (49.4)
|
Missing
/ other care givers
|
35 (11.2)
|
-
|
-
|
Table
II: parent’s education level.
Parents
education level
|
Malema
|
Gurué
|
Father
n (%)
|
Mother
n (%)
|
Total
n (%)
|
Father
n (%)
|
Mother
n (%)
|
Total
n (%)
|
Never
studied
|
44 (15.1)
|
57 (19.5)
|
101 (17.3)
|
52 (18.2)
|
74 (26.0)
|
126 (21.6)
|
Primary
(Incomplete)
|
152 (52.1)
|
175 (59.9)
|
327 (56.0)
|
163 (57.2)
|
183 (64.2)
|
346 (60.8)
|
Primary
(Complete)
|
45 (15.4)
|
29 (9.9)
|
74 (12.7)
|
27 (9.5)
|
12 (4.2)
|
39 (6.9)
|
Secondary
(Incomplete)
|
37 (12.7)
|
26 (8.9)
|
63 (10.8)
|
35 (12.3)
|
13 (4.6)
|
48 (8.7)
|
Nutritional evaluation.
Table III shows infants and mother’s anthropometric
data. Children born with low birth weight (< 2,500 g) were 115 (18.8 %);
they face numerous challenges and may often not attain their full potential as
adults. (11) A cohort of children born underweight followed by WHO for
the first eight years of life concluded that these children had poor cognitive
function, academic achievement, and behaviours at eight years. The existence of
a population born underweight is not only a health concern but also affects this
population’ social and economic achievements. (12)
About 30 % of children did not have
child growth monitoring cards and did not provide the weight at birth. This is
consistent with the findings of the MDHS reporting that 80 % of respondents had
a child growth - monitoring card. Major reason for children not having a growth
- monitoring card is that the child was born at home. While delivery care is
critical for both mother and new-born, slow progress has been registered ensuring
women get skilled health professionals delivery care. According to the MMDGR, skilled
health personnel attended 48 % of deliveries in 2003 compared with 44 % in
1997. Reasons cited included lack of women’s decision-making power, perceptions
of risk, traditional beliefs and practices, long distances and poor transport
to a maternity.
Children participating in the study
were less than two years of age. Chronic undernutrition attained 6 % while 14.8
% presented acute undernutrition (≥ -2 Z score). Prevalence of acute undernutrition
registered in this study was slightly higher than that reported in the MDHS
(6.4 -10.5 %). Trends in prevalence of chronic undernutrition observed in this
study were lower than the rates reported in the same survey (27.6 - 48.1 %).
Most mothers (71.5 %) had a normal BMI,
overweight was observed among 14 % and 12 % were underweight. The referred survey
reported underweight levels of 9.8 %, overweight levels of 10.5 % and normal BMI
among 79.7 % of rural women. Another study comparing data from 36 developing
countries (Mozambique was not included) found that overweight exceeded
underweight among women of reproductive age. (13) Underweight among
women of reproductive age is a health concern as such women are at a high risk
of having low birth weight children, (14) especially if adequate
weight is not gained during pregnancy. (15) The MDHS found the
mothers’ BMI has an inverse relationship with stunting; mothers who are thin (BMI
< 18.5) had children with the highest stunting level (45 %). No anthropometric
measurements for both mother and child were significantly different for the two
districts (p < 0.05).
Table III: children and mothers’ anthropometric
characteristics.
Anthropometric
characteristics of children and mothers
|
Total
n (%)
|
Malema
n (%)
|
Gurué
n (%)
|
p
|
Birth
weight < 2,500g
|
115 (18.8)
|
57 (18.0)
|
58 (19.7)
|
0.084*
|
Birth
weight > 2,500g
|
330(53.9)
|
184 (58.0)
|
146 (49.5)
|
No
response
|
167 (27.3)
|
76 (24.0)
|
91 (30.8)
|
Weight/age
|
|
|
|
|
<
- 2 Z-score
|
22 (3.6)
|
15 (4.7)
|
7 (2.4)
|
0.274*
|
>
- 2 Z-score
|
577 (94.3)
|
296 (93.4)
|
281 (95.3)
|
Missing
|
13 (2.1)
|
6 (1.9)
|
7 (2.4)
|
Chronic undernutrition
(height/age)
|
|
|
|
|
<
- 2 Z-score
|
37 (6.0)
|
21 (6.6)
|
16 (5.4)
|
0.769*
|
>
- 2 Z-score
|
558 (91.2)
|
288 (90.9)
|
270 (91.5)
|
Missing
|
17 (2.8)
|
8 (2.5)
|
9 (3.1)
|
Acute undernutrition
(weight/height)
|
|
|
|
|
<
- 2 Z-score
|
94 (15.4)
|
47 (14.8)
|
47 (15.9)
|
0.849*
|
> - 2 Z-score
|
487 (79.6)
|
255 (80.4)
|
232 (78.6)
|
Missing
|
31 (5.1)
|
15 (4.7)
|
16 (5.4)
|
Mothers BMI
|
|
|
|
|
Underweight
|
71 (12.3)
|
38 (13.0)
|
33 (11.6)
|
0.240**
|
Normal
|
412 (71.4)
|
212 (72.6)
|
200 (70.2)
|
Overweight
|
80 (13.9)
|
33 (11.3)
|
47 (16.5)
|
Obese
|
-
|
-
|
-
|
Missing
|
14 (2.4)
|
9 (3.1)
|
5 (1.8)
|
* Chi-square ** Fisher test
Most mothers (526 or 91.2 %) attended
prenatal health care. Receipt of nutritional education during pregnancy was
reported by 67.2 % and 65 % received it in health facilities (Table IV). A
lower number of mothers (51.0 %) had received post-natal nutritional education.
There was no significant difference between attendance of pre and post-natal
health care services for the two districts. Nutritional support is crucial
during ante and post-natal periods to ensure good pregnancy outcomes and a good
start in life for the new-born. Possibly the low prevalence of child undernutrition
among respondents can be attributed to high attendance to nutritional
education. Along with our research, local health facilities were implementing
community level integrated strategies to reduce undernutrition, especially
child undernutrition, through forums held at the health facilities and at
community level. A community children health intervention implemented in Chokwé
district Mozambique (South), under typical resource constraints environment, demonstrated
it can improve child-wellbeing. (16) Another randomized control
trial in 2004 showed that nutritional education leads to better nutrition
outcomes, even among very poor families in Mexico. (17)
Table IV: nutritional education during pre-and
post-natal care.
Item/District
|
Malema
|
Gurué
|
Total
|
p
|
Attended
pre-natal clinic
|
Yes
n (%)
|
No
n (%)
|
Yes
n (%)
|
No
n (%)
|
Yes
n (%)
|
No
n (%)
|
|
267 (91.4)
|
17 (5.8)
|
259 (90.9)
|
20 (7.0)
|
526 (91.2)
|
37 (6.4)
|
0.754*
|
Item/
District
|
Malema
|
Gurué
|
Total
|
p
|
Received nutritional
education during pregnancy
|
Yes
n (%)
|
No
n (%)
|
Yes
n (%)
|
No
n (%)
|
Yes
n (%)
|
No
n (%)
|
|
204 (69.9)
|
84
(28.8)
|
184
(64.6)
|
94
(33.0)
|
388
(67.2)
|
178
(30.8)
|
0.312*
|
Where did you
receive nutritional education during pregnancy
|
Malema
n (%)
|
Gurué
n (%)
|
Total
n (%)
|
P
|
Health
Centre
|
196 (67.1)
|
179 (62.8)
|
375 (65.0)
|
0.700**
|
Non-governmental
organization
|
2 (0.6)
|
1 (0.3)
|
3 (0.4)
|
Community
workers (Ministry of Health)
|
1 (0.3)
|
1 (0.3)
|
2 (0.3)
|
Private
clinic
|
-
|
-
|
-
|
Others
|
5 (1.2)
|
3 (0.6)
|
8 (1.0)
|
Item/
District
|
Malema
|
Gurué
|
Total
|
p
|
Yes
n (%)
|
No
n (%)
|
Yes
n (%)
|
No
n (%)
|
Yes
n (%)
|
No
n (%)
|
0.938*
|
Nutritional
education during post-natal care
|
150 (51.4)
|
136 (46.6)
|
144 (50.5)
|
136 (47.7)
|
294 (51.0)
|
272 (47.1)
|
Where did you
receive nutritional education during post-natal care
|
Malema
n (%)
|
Gurué
n (%)
|
Total
n (%)
|
P
|
Health
facility
|
143 (49.0)
|
136 (47.7)
|
279 (48.4)
|
0.774*
|
Non-governmental
organization
|
0 (0.0)
|
0 (0.0)
|
0 (0.0)
|
Community
workers (Ministry of Health)
|
2 (0.7)
|
0 (0.0)
|
2 (0.3)
|
Private
clinic
|
-
|
-
|
-
|
Others
|
5 (1.7)
|
0 (0.0)
|
5 (0.4)
|
*
Chi-square **Fisher-test
Table V shows trends in exclusive breast-feeding
and introduction of solid foods. Mostly mothers are responsible for child
feeding (80.4 %) and to make decisions on child feeding practices and age at
which solid foods and complementary feeding is initiated (66.9 %). Most
children receive exclusive breast-feeding for 5 - 6 months (46.6 %). There was
a significant difference between Malema and Gurué districts regarding exclusive
breast-feeding, with Malema children breastfed for a longer period. Exclusive
breast-feeding reduces infant morbidity and mortality through enhanced immunity
and reduced incidence of disease, especially diarrhoea. (18)
Complementary period, the time when
infants are introduced to other foods in addition to breast milk (6 - 23 months),
is sensitive to stunting, with life-long and possibly irreversible
consequences. (19) Maize flour thin porridge was the common first
food introduced to infants (96.4 %) mainly at the age of 5 - 6 months. Starchy
staples such as maize have been reported as major complementary foods in Africa.
(20, 21) Thin starchy porridges have been implicated in causing undernutrition
in Sub-Saharan Africa countries. (22) Cereal based thin porridges do
not meet the children nutrient needs due to their limited energy density. (23)
In addition, due to small gastric capacity of about 250 g for children aged 6
months and 350 g for those aged 23 months, they cannot eat enough of the low
energy density traditional complementary porridges to meet their energy needs.
About 28 % of mothers reported to add oil or groundnut powder to the thin porridge,
especially sunflower oil. Addition of oil to maize flour porridge may improve energy
density of complementary porridges, due to the high caloric value of fat (9 kcal
/ g) as compared to carbohydrate (4 kcal / g); oil inclusion provides essential
fatty acids indispensable for proper development of the nervous system.
Nutritional
education messages must be well targeted to reach women, because mothers were
responsible for decisions on child feeding for 80 % of respondents. The use of
the health facilities to disseminate nutritional education seems a good
approach, as most women reported to have received this education from health
facilities, particularly during ante and post-natal consultations. Given the
limited access to other channels of information, an integrated mother and child
health project may need to strengthen nutritional education through health
facilities.
Table V: introduction of solid foods/complementary
feeding.
|
Malema
n (%)
|
Gurué
n (%)
|
Total
n (%)
|
p
|
Who is
responsible for child feeding?
|
|
|
|
|
Father
|
46 (15.8)
|
33 (11.6)
|
79 (13.7)
|
0.167**
|
Mother
|
226 (77.4)
|
238 (83.5)
|
464 (80.4)
|
Others
|
4 (1.4)
|
0 (0.0)
|
4 (0.7)
|
Grand
- mother
|
3 (1.0)
|
3 (1.1)
|
6 (1.0)
|
Until which age
is exclusive breast-feeding done?
|
|
|
|
|
2
- 3 Months
|
27 (9.2)
|
29 (10.2)
|
56 (9.7)
|
0.029*
|
3
- 4 Months
|
42 (14.4)
|
64 (22.5)
|
106 (18.4)
|
4
- 5 Months
|
53 (18.2)
|
49 (17.2)
|
102 (17.7)
|
5
- 6 Months
|
153 (52.4)
|
116 (40.7)
|
269 (46.6)
|
More
than 6 months
|
8 (2.7)
|
10 (3.5)
|
18 (3.1)
|
No
response
|
9 (3.1)
|
17 (6.0)
|
26 (4.5)
|
Who decides when
to introduce solid foods to a baby?
|
|
|
|
|
Father
|
44 (15.1)
|
41 (14.4)
|
85 (14.7)
|
0.131*
|
Mother
|
202 (69.2)
|
184 (64.6)
|
386 (66.9)
|
Grand
father
|
3 (1.0)
|
8 (2.8)
|
11 (1.9)
|
No
response
|
10 (3.4)
|
21 (7.4)
|
31 (5.4)
|
Others
|
33 (11.3)
|
31 (10.9)
|
64 (11.1)
|
At what age are
solid foods introduced?
|
|
|
|
|
2
- 3 Months
|
14 (4.8)
|
20 (7.0)
|
34 (5.9)
|
0.051*
|
3
- 4 Months
|
27 (9.2)
|
46 (16.1)
|
73 (12.7)
|
4
- 5 Months
|
43 (14.7)
|
38 (13.3)
|
81 (14.0)
|
5
- 6 Months
|
148 (50.7)
|
117 (41.1)
|
265 (45.9)
|
More
than 6 months
|
55 (18.8)
|
55 (19.3)
|
110 (19.1)
|
No
response
|
5 (1.7)
|
9 (3.2)
|
14 (2.4)
|
Which is the
first solid food provided to babies?
|
|
|
|
|
Maize
flour thin porridge
|
285 (97.6)
|
271 (95.1)
|
556 (96.4)
|
0.436**
|
Cassava
flour thick porridge
|
1 (0.2)
|
0 (0.0)
|
1 (0.1)
|
|
Biscuit
|
3 (1.1)
|
0 (0.0)
|
3 (0.5)
|
|
Maize
flour thick porridge
|
3 (1.1)
|
14 (4.9)
|
17 (3.0)
|
|
At what age do children
eat family diet?
|
|
|
|
p
|
Less
than 2 months
|
6 (2.1)
|
2 (0.7)
|
8 (1.4)
|
<0 .001="" o:p="">
|
*
Chi-square ** Fisher test
Median energy intake among children
under two years was 802 Kcal. There was no significant difference between boys
and girls. This intake met the recommended dietary expected from complementary
foods up to 23 months except for children aged 12 - 23 months receiving low
energy from breast milk.
This rate of rather sufficient intake of energy is consistent with the low
prevalence of chronic undernutrition, which was reported at 6 %. Similarly,
total energy consumption was 1,304 Kcal, within the recommended intake for non-pregnant
women. This may also explain why most of the women had a normal BMI.
Protein median consumption among children
was 25.3 g. This rate is about threefold higher than the recommended protein
intake from complementary foods, assuming a child is breast-feeding as is
expected for children below two years. The high protein intake may explain the
relatively low prevalence of undernutrition among respondents. Some authors
suggested that a high protein intake stimulates insulin secretion, which in
turn stimulates weight gain. (24, 25)
Protein median consumption among children
was 13 % of total energy. Main sources of protein are legumes with limited
contribution from animal foods (Figure1a). This trend may be of concern
considering legumes do not have a balanced profile of essential amino acids.
Higher than recommended intake of protein has been reported in studies that
aimed to evaluate long-term effects of high protein intake during infancy. A
study in France showed an average intake of protein of 16.3 % of total energy
while in Italy was 20 %. Studies about high protein intake effects on children
are inconsistent but a correlation with obesity later in life has been
suggested. (26, 27)
Vitamin A median intake was 170.7 µg,
lower than the recommended 350 µg, consistent with the trends reported using
the FFQ, showing that a minority of respondents consumed vitamin A rich food,
such as fruits and vegetables on daily basis (< 30 %) (Figure 1a). Further
still, the frequency of consumption of animal source foods was also low in a daily
basis. A randomized control trial among Mozambican children found 60 % had low
serum retinol (< 0.70 µmol / L) and another author reported 71 % of vitamin
A deficiency in children under five years. (28, 29)
Iron median intake was 5.8 mg, lower
than the recommended (7 mg) for pre-schoolers. Prevalence of anaemia has been
categorized as severe in Mozambique (≤ 40 %). Possibly these low intake of
foods rich in iron, may in part explain the high prevalence of iron deficiency
in Mozambique. Figure1 (a, b) shows that food rich in iron consumption is low (for
animal and plant sources).
Evaluating nutrients inadequacy prevalence
in children, the most deficient are phosphorus (78.5 %), calcium (80.1 %), zinc
(60.1 %), iodine (98.6 %), vitamin B2 (76.4 %), vitamin B6 (65.4 %), B12 (87.2 %)
and vitamin D (99.5 %). Considering micronutrients as vitamin A, vitamin B1,
vitamin C, E, iron and folate, the prevalence of inadequacy is lower, showing
individuals within or even above recommendations (Table VI).
Children’s
mothers present a median energy intake of 1,029 Kcal. Evaluating inadequacy prevalence,
most mothers have a nutrient intake lower than recommended. Micronutrients with
the greatest deficiency are magnesium (93.6 %), zinc (90.6 %), iodine (99.5 %),
vitamin B2 (95.1 %), vitamin B6 (91.0 %), vitamin B12 (91.1 %) and vitamin D
(99.7 %).
Table VI: prevalence of nutritional
intake inadequacy in children under two years of age using EAR cut-off, AI and
UL.
|
Boys
|
Girls
|
Total
|
p
|
Below
n
(%)
|
Equal
n
(%)
|
Above
n
(%)
|
Below
n
(%)
|
Equal
n
(%)
|
Above
n
(%)
|
Below
n
(%)
|
Equal
n
(%)
|
Above
n
(%)
|
Energy
intake (Kcal)
|
69 (23,8)
|
-
|
221 (76,2)
|
60 (18,8)
|
-
|
259 (81,2)
|
129 (21,2)
|
-
|
480 (78,8)
|
0,133**
|
Protein
(% TEV)
|
1 (0,3)
|
99 (34,1)
|
190 (65,5)
|
1 (0,3)
|
113 (35,4)
|
205 (64,3)
|
2 (0,3)
|
212 (34,8)
|
395 (64,9)
|
0,757*
|
Carbohydrates
(% TEV)
|
15 (5,2)
|
37 (12,8)
|
238 (82,1)
|
17 (5,3)
|
37 (11,6)
|
265 (83,1)
|
32 (5,3)
|
74 (12,2)
|
503 (82,6)
|
0,844*
|
Total
fat (% TEV)
|
137 (47,2)
|
71 (24,5)
|
82 (28,3)
|
152 (47,6)
|
68 (21,3)
|
99 (31,0)
|
289 (47,5)
|
139 (22,8)
|
181 (29,7)
|
0,737*
|
Phosphor
(mg)
|
222 (76,6)
|
-
|
68 (23,4)
|
256 (80,3)
|
-
|
63 (19,7)
|
478 (78,5)
|
-
|
131 (21,5)
|
0,268**
|
Calcium
(mg)
|
233 (80,3)
|
-
|
57 (19,7)
|
255 (79,9)
|
-
|
64 (20,1)
|
488 (80,1)
|
-
|
121 (19,9)
|
0,900*
|
Iron
(mg)
|
45 (15,5)
|
1 (0,3)
|
244 (84,1)
|
54 (16,9)
|
1 (,3)
|
264 (82,8)
|
99 (16,3)
|
2 (0,3)
|
508 (83,4)
|
0,642*
|
Magnesium
(mg)
|
132 (45,5)
|
|
158 (54,5)
|
154 (48,3)
|
|
165 (51,7)
|
286 (47,0)
|
|
323 (53,0)
|
0,497*
|
Zinc
(mg)
|
170 (58,6)
|
1 (0,3)
|
119 (41,0)
|
196 (61,4)
|
-
|
123 (38,6)
|
366 (60,1)
|
1 (0,2)
|
242 (39,7)
|
0,505*
|
Iodine
(mg)
|
178 (98,3)
|
-
|
3 (1,7)
|
179 (98,9)
|
-
|
2 (1,1)
|
357 (98,6)
|
-
|
5 (1,4)
|
0,654*
|
Vitamin
A (µg)
|
48 (16,6)
|
-
|
242 (83,4)
|
39 (12,2)
|
-
|
280 (87,8)
|
87 (14,3)
|
-
|
522 (85,7)
|
0,128*
|
Vitamin
B1 (mg)
|
129 (44,5)
|
1 (0,3)
|
160 (55,2)
|
144 (45,1)
|
3 (0,9)
|
172 (53,9)
|
273 (44,8)
|
4 (0,7)
|
332 (54,5)
|
0,813*
|
Vitamin
B2 (mg)
|
218 (75,2)
|
3 (1,0)
|
69 (23,8)
|
247 (77,4)
|
1 (0,3)
|
71 (22,3)
|
465 (76,4)
|
4 (0,7)
|
140 (23,0)
|
0,579*
|
Vitamin
B6 (mg)
|
188 (64,8)
|
6 (2,1)
|
96 (33,1)
|
210 (65,8)
|
6 (1,9)
|
103 (32,3)
|
398 (65,4)
|
12 (2,0)
|
199 (32,7)
|
0,811*
|
Vitamin
B12 (µg)
|
246 (84,8)
|
1 (0,3)
|
43 (14,8)
|
285 (89,3)
|
0 (0,0)
|
34 (10,7)
|
531 (87,2)
|
1 (0,2)
|
77 (12,6)
|
0,099**
|
Vitamin
C (mg)
|
47 (16,2)
|
-
|
243 (83,8)
|
32 (10,0)
|
-
|
287 (90,0)
|
79 (13,0)
|
-
|
530 (87,0)
|
0,024**
|
Vitamin
D (µg)
|
289 (99,7)
|
-
|
1 (0,3)
|
317 (99,4)
|
-
|
2 (0,6)
|
606 (99,5)
|
-
|
3 (0,5)
|
0,620*
|
Vitamin
E (mg)
|
125 (43,1)
|
-
|
165 (56,9)
|
141 (44,2)
|
-
|
178 (55,8)
|
266 (43,7)
|
-
|
343 (56,3)
|
0,786*
|
Folate
(µg)
|
133 (45,9)
|
-
|
157 (54,1)
|
154 (48,3)
|
-
|
165 (51,7)
|
287 (47,1)
|
-
|
322 (52,9)
|
0,552*
|
|
AI
|
UL
|
M ±
sd
|
Fibre (g)
|
19
|
|
1,1 ± 0,5
|
Sodium (mg)
|
|
1,5
|
3,0 ± 0,1
|
Potassium (mg)
|
3
|
|
3,0 ± 0,3
|
TEV: Total Energetic
Value *One-Way Anova test **Kruskal-Wallis test
M – medium sd – standard deviation. For nutrients without
an established EAR, we used the AI value. We verified that the mean fibre
intake in children was 1.1 g / day (recommended 19 g / day). For mothers, the
average consumption was 1.3 g / day (recommended for adults 25 g / day). For potassium,
the average consumption in children is equal to the recommended value (3 mg / day).
In the case of mothers, the average consumption is higher than recommended (4.7
g / day). As for sodium, the average consumption of children and mothers is
higher than the value considered as limit with no harmful effects on health, 3 g
/ day in both groups.
Analysing macronutrients average
contribution to total energy value (TEV) in children (920 kcal / day), we verified
that fat contributed on average to 14.3 % and carbohydrates and proteins
respectively 55.4 % and 13.5 %. The same analysis for mothers showed an average
contribution (macronutrients) to the TEV (1,304 kcal / day) of 14.6 %, 63.0 %
and 22.3 % for protein, carbohydrate and fat, respectively.
4. Conclusions and
recommendations.
We found a significantly low
prevalence of chronic undernutrition (14.8 %) in children under two years of
age, when compared to the 34 % among under five reported in 2011 in Mozambique,
and a higher intake of protein than the recommended.
Malema and Gurué districts produce
various crops that can be promoted for home consumption through integrated
agriculture and nutrition projects. Such integrated projects have a potential
to reduce undernutrition, particularly in regions typically considered as food
baskets. Given the high agricultural productivity of Malema and Gurué
districts, achieving good child and maternal nutrition through an integrated
project is feasible. Such a project would contribute to reverse the high
prevalence of children born underweight (18.8 %), the prevalence of underweight
(12 %) and overweight (14 %) among mothers and also the inadequacy of
consumption of several nutrients in both children and mothers.
Thus, an integrated agricultural and
nutrition project implemented with full detail of food production and
malnutrition status, particularly focusing on the first 1,000 days, has a
potential to reverse the emerging double burden malnutrition in Mozambique.
This study guides on how nutritional education messaging would need to be
packaged to improve malnutrition. A platform to disseminate these targeted
messages to mothers is already provided by the high attendance of ante and
post-natal clinics.
Acknowledgement: we
acknowledge financial support from Common Fund for Commodities for the project ‘Integration of Small-Scale Farmers
into the Market Economy through Soybean Value Chains.
Acesso grátis em: https//edupediapublications.org/journals/index.php/IJR/